Open Mainframe Project Summer Mentorship Series: Midterm Updates – At this midpoint, our selected mentees are reporting in. Below, you’ll learn what they’ve built, the challenges they’ve overcome, and their goals for the rest of the summer. We’re proud of every contribution and eager to see what comes next. Hear from Rohan Sen, Indian Institute of Information Technology, Design and Manufacturing, Jabalpur below.
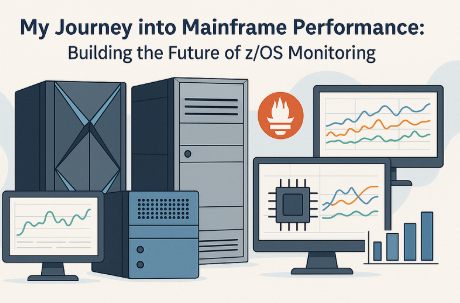
Hello everyone! I’m really excited today to share my incredible journey as an LFX mentee under the Open Mainframe Project (OMP), focusing on an exciting initiative: z/OS Performance Monitoring. This mentorship has opened my eyes to the critical world of mainframe system development and the innovative ways we’re bringing modern DevOps and AI/ML capabilities to this robust environment. The mainframe, often seen as a traditional computing platform, is actively undergoing a significant modernization, and I’m immensely excited to be a part of this transformation.
Demystifying z/OS Performance: My Mentorship Mission
The core of my LFX mentorship project is to create a cutting-edge performance methodology for analysing RMF Monitor III data. Resource Measurement Facility (RMF) is IBM’s strategic product for performance management within the z/OS environment, and Monitor III specifically focuses on short-term, real-time data collection for rapid problem determination. This data is crucial for understanding how hardware resources are being consumed and the overall utilization levels of critical components.
My journey involves several key stages:
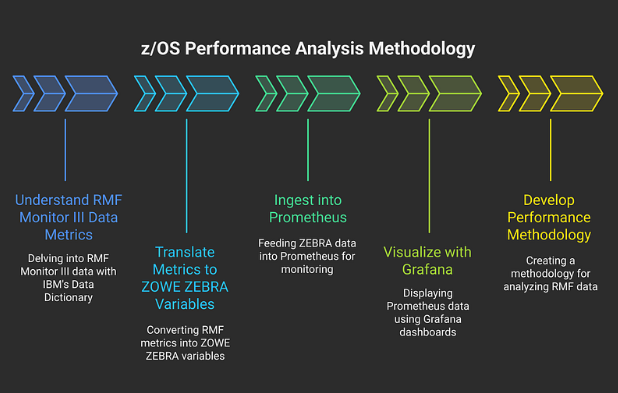
- Understanding RMF Monitor III Data Metrics: This foundational step requires delving into the extensive RMF Monitor III data, with guidance from an IBM-provided Data Dictionary. This helps to make sense of the over 55,000 different fields that RMF Monitor III can provide.
- Translating Metrics to ZOWE ZEBRA Variables: Once understood, these RMF Monitor III metrics need to be translated into variables that ZOWE ZEBRA can process. ZEBRA, an open-source incubator project within the Zowe ecosystem, built by Krishi Jain, acts as a data parsing framework that provides quick and easy access to z/OS performance metrics by transforming them into a reusable, industry-compliant JSON format. ZEBRA achieves this by requiring a running instance of the RMF Distributed Data Server (DDS), also known as GPMSERVE, on the z/OS system, which in turn obtains its data from RMF Monitor III.
- Ingesting into Prometheus: ZEBRA is designed to expose the RMF data it collects to Prometheus using a specific, custom metric format. Prometheus is a widely adopted open-source toolkit for systems monitoring and alerting, renowned for its time-series data model. It collects and stores data as time-stamped values, identified by metric names and optional key-value pairs (labels), which are critical for flexible querying and aggregation.
- Visualizing with Grafana: The ingested data in Prometheus is then visualized using Grafana, a popular open-source platform for monitoring and observability. Grafana excels at connecting to various data sources, including Prometheus, to create interactive and highly customizable dashboards tailored for time-series data.
- Developing a Performance Methodology: A central objective is to design a performance methodology for analyzing RMF Monitor III data to identify bottlenecks and anomalies. This involves learning existing IBM z/OS performance methodologies and integrating these concepts into Grafana dashboards for deep analytics and correlation. This methodology needs to be easily customisable by a customer to adapt to their unique z/OS environment and specific monitoring needs.
My RMF Simulator: A Playground for Me
To complement my mentorship work, I’ve been actively developing the RMF Monitor III Data Simulator. This project is a production-ready z/OS mainframe metrics simulator designed to generate realistic IBM RMF Monitor III data with authentic workload patterns. It simulates key z/OS metrics like CPU (GP, zIIP, zAAP), memory (real/virtual/CSA), I/O, coupling facility, and network performance, while also supporting dynamic workload patterns and multi-LPAR environments.
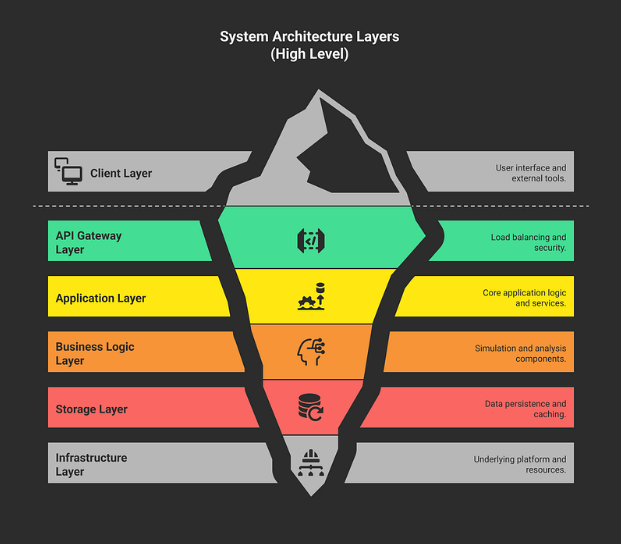
One of my key aims with the simulator is to experiment with a modularized structure. The architecture of the simulator already demonstrates this, as it consists of a FastAPI application that interacts with Prometheus for metrics and Grafana for dashboards, all while simultaneously storing data across multiple storage backends like MySQL, MongoDB, and S3 (MinIO). The intention is to enable easy extensibility, for example, by allowing users to add a new storage backend simply by creating a new module, implementing a storage interface, adding configuration options, and updating the simulator. This modular approach is fundamental for building flexible and maintainable systems, perfectly aligning with modern DevOps principles.
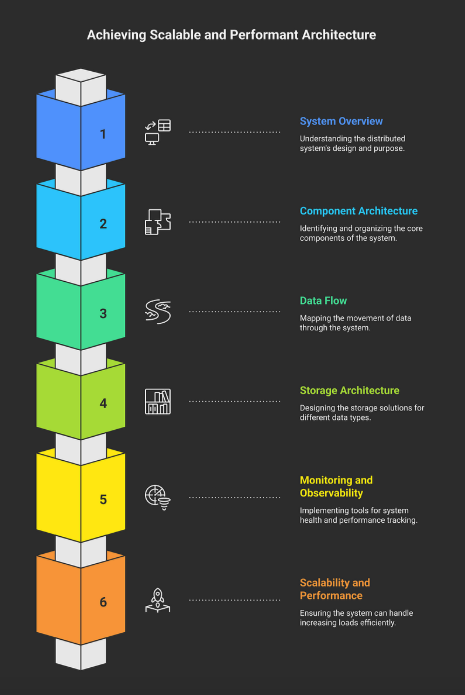
The entire codebase is open sourced for anyone enthusiastic! You can view the codebase here: https://github.com/rohansen856/rmf-simulator
It’s important to note that this simulator is intended for educational and testing purposes, generating synthetic data that resembles real mainframe metrics. It’s a fantastic environment for me to iterate on ideas and test concepts before applying them to real-world data.
Mainframe Anomaly Detection with AI/ML
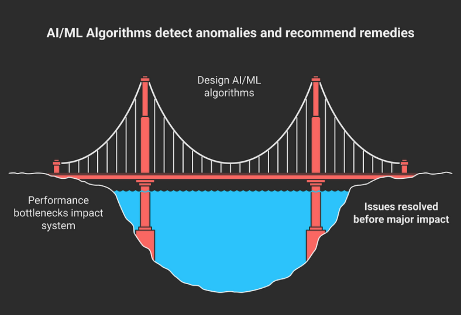
A major and thrilling part of my project is to design AI/ML algorithms to automatically detect performance bottlenecks and anomalies. This goes beyond traditional threshold-based monitoring, aiming to identify subtle deviations from normal operational behaviour. IBM Z Anomaly Analytics, for instance, already leverages both log-based and metric-based machine learning to proactively discern operational issues in z/OS environments by building models of normal behaviour from historical data.
My plan for building this ML model includes:
- Learning Normal Patterns: AI/ML techniques will be employed to learn the typical patterns within the z/OS performance time-series data.
- Identifying Deviations: Algorithms will then identify data points or sequences that deviate significantly from these established patterns. This could involve various methods, from simpler statistical techniques like Z-scores or Interquartile Range (IQR) to more sophisticated approaches like time series decomposition (e.g., STL), moving averages, ARIMA models, or unsupervised learning algorithms such as Isolation Forest, One-Class SVM, K-Means Clustering, and Autoencoders. For capturing complex temporal dependencies, Long Short-Term Memory (LSTM) neural networks are also highly suitable.
- Grafana Integration: The goal is to integrate these AI/ML algorithms directly with Grafana dashboards. This could involve crafting advanced PromQL queries that incorporate anomaly detection logic to trigger alerts within Grafana, or setting up external AI/ML services that continuously analyse Prometheus data and send results back to Grafana for visualization.
- Generating Recommended Remedies: The most ambitious and impactful part is to not just detect anomalies but also to output recommended remedies based on the detected issues. This requires a deep understanding of z/OS performance tuning and troubleshooting, potentially mapping detected anomalies to predefined sets of corrective actions.
Accessing the Mainframe Lab: Gateway via HALO
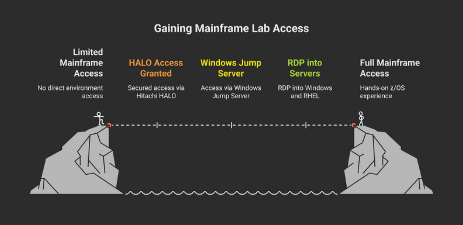
To execute and validate these methodologies, I need access to a mainframe environment. I’m incredibly fortunate to have secured access to the Hitachi Vantara mainframe lab through Hitachi Automated Labs Online (HALO). This provides me with a Windows Jump Server, from which I can RDP into both a Windows 11 and a RHEL 9 server. Unfortunately, I won’t have access to the internet on the servers, but that’s another challenge I’m ready to take on. The necessary development tools will be preinstalled by the Hitachi Vantara team. Both servers will be on the same network as other team members, enabling seamless data sharing and providing invaluable hands-on experience with z/OS performance data.
My Enthusiasm for DevOps and a Supportive Community
I am incredibly excited to be working in the DevOps field, especially at the intersection of modern cloud-native tools and the robust world of mainframes. The Open Mainframe Project, through initiatives like Zowe, is dedicated to modernising mainframe interaction by providing secure, manageable, and scriptable interfaces that mirror contemporary cloud platform experiences. My project, “Demystifying z/OS Performance Monitoring: A Beginner’s Guide to Modern Techniques,” perfectly embodies this vision, pushing the boundaries of what’s possible in z/OS performance analysis.
This is a challenging yet immensely rewarding field, and I’m grateful for the opportunity to contribute.
A Heartfelt Thank You
This journey wouldn’t be possible without incredible support. I want to extend my deepest gratitude to my mentors, Krishi Jain and Joe Carlisle, for their invaluable guidance, insights, and unwavering support throughout this mentorship. Their expertise has been instrumental in shaping my understanding and progress.
Finally, I am profoundly thankful to LFX and the Open Mainframe Project for providing this extraordinary platform and connecting me to such a strong and supportive community. It’s truly an honour to be part of this initiative, working alongside passionate individuals committed to advancing mainframe technology.
Thank you for reading, and stay tuned for more updates on my progress!
Rohan Sen LFX’25 @OMP | SoB’25 @Braidpool | C4GT DMP’25 @SocialCalc | 5x hackathon winner || 3⭐ @Codechef | Pupil @Codeforces || 🚀 Blockchain & Cloud Developer | 🧊 3d modeling @Maya+Blender || CSE @ IIITDMJ’27
